
Visualizing the Unseen
Visualizing the Unseen grew out of Synergy II, a multi-year collaboration between the Art League of Rhode Island and Woods Hole Oceanographic Institute (WHOI). The project paired scientists with artists to create a “common language” using art to communicate the science.
Click here to read about the project and how the collaboration evolved

Coastal Surface: Communities. 48x60. Oil over Acrylic on Canvas This work is the visualization of chemical data collected in surface water off the coast of Cape Cod. We see active water as full of movement, with vibrant areas of bloom and bust, rich mixtures of both land-derived and oceanic molecules. This is where we find pharmaceuticals and pollutants and harmful algal toxins, where nutrients are often amplified by human activity. It’s a green, algae-filled mess.

Ocean Surface: Desert. 48x60. Oil on Canvas This work is the visualization of chemical data collected in surface water in the Atlantic Ocean far off the coast of Bermuda. The relentless sun forces the metabolites sink down during the daylight hours, or risk being destroyed. The chemical data suggests this zone is an ocean "desert."
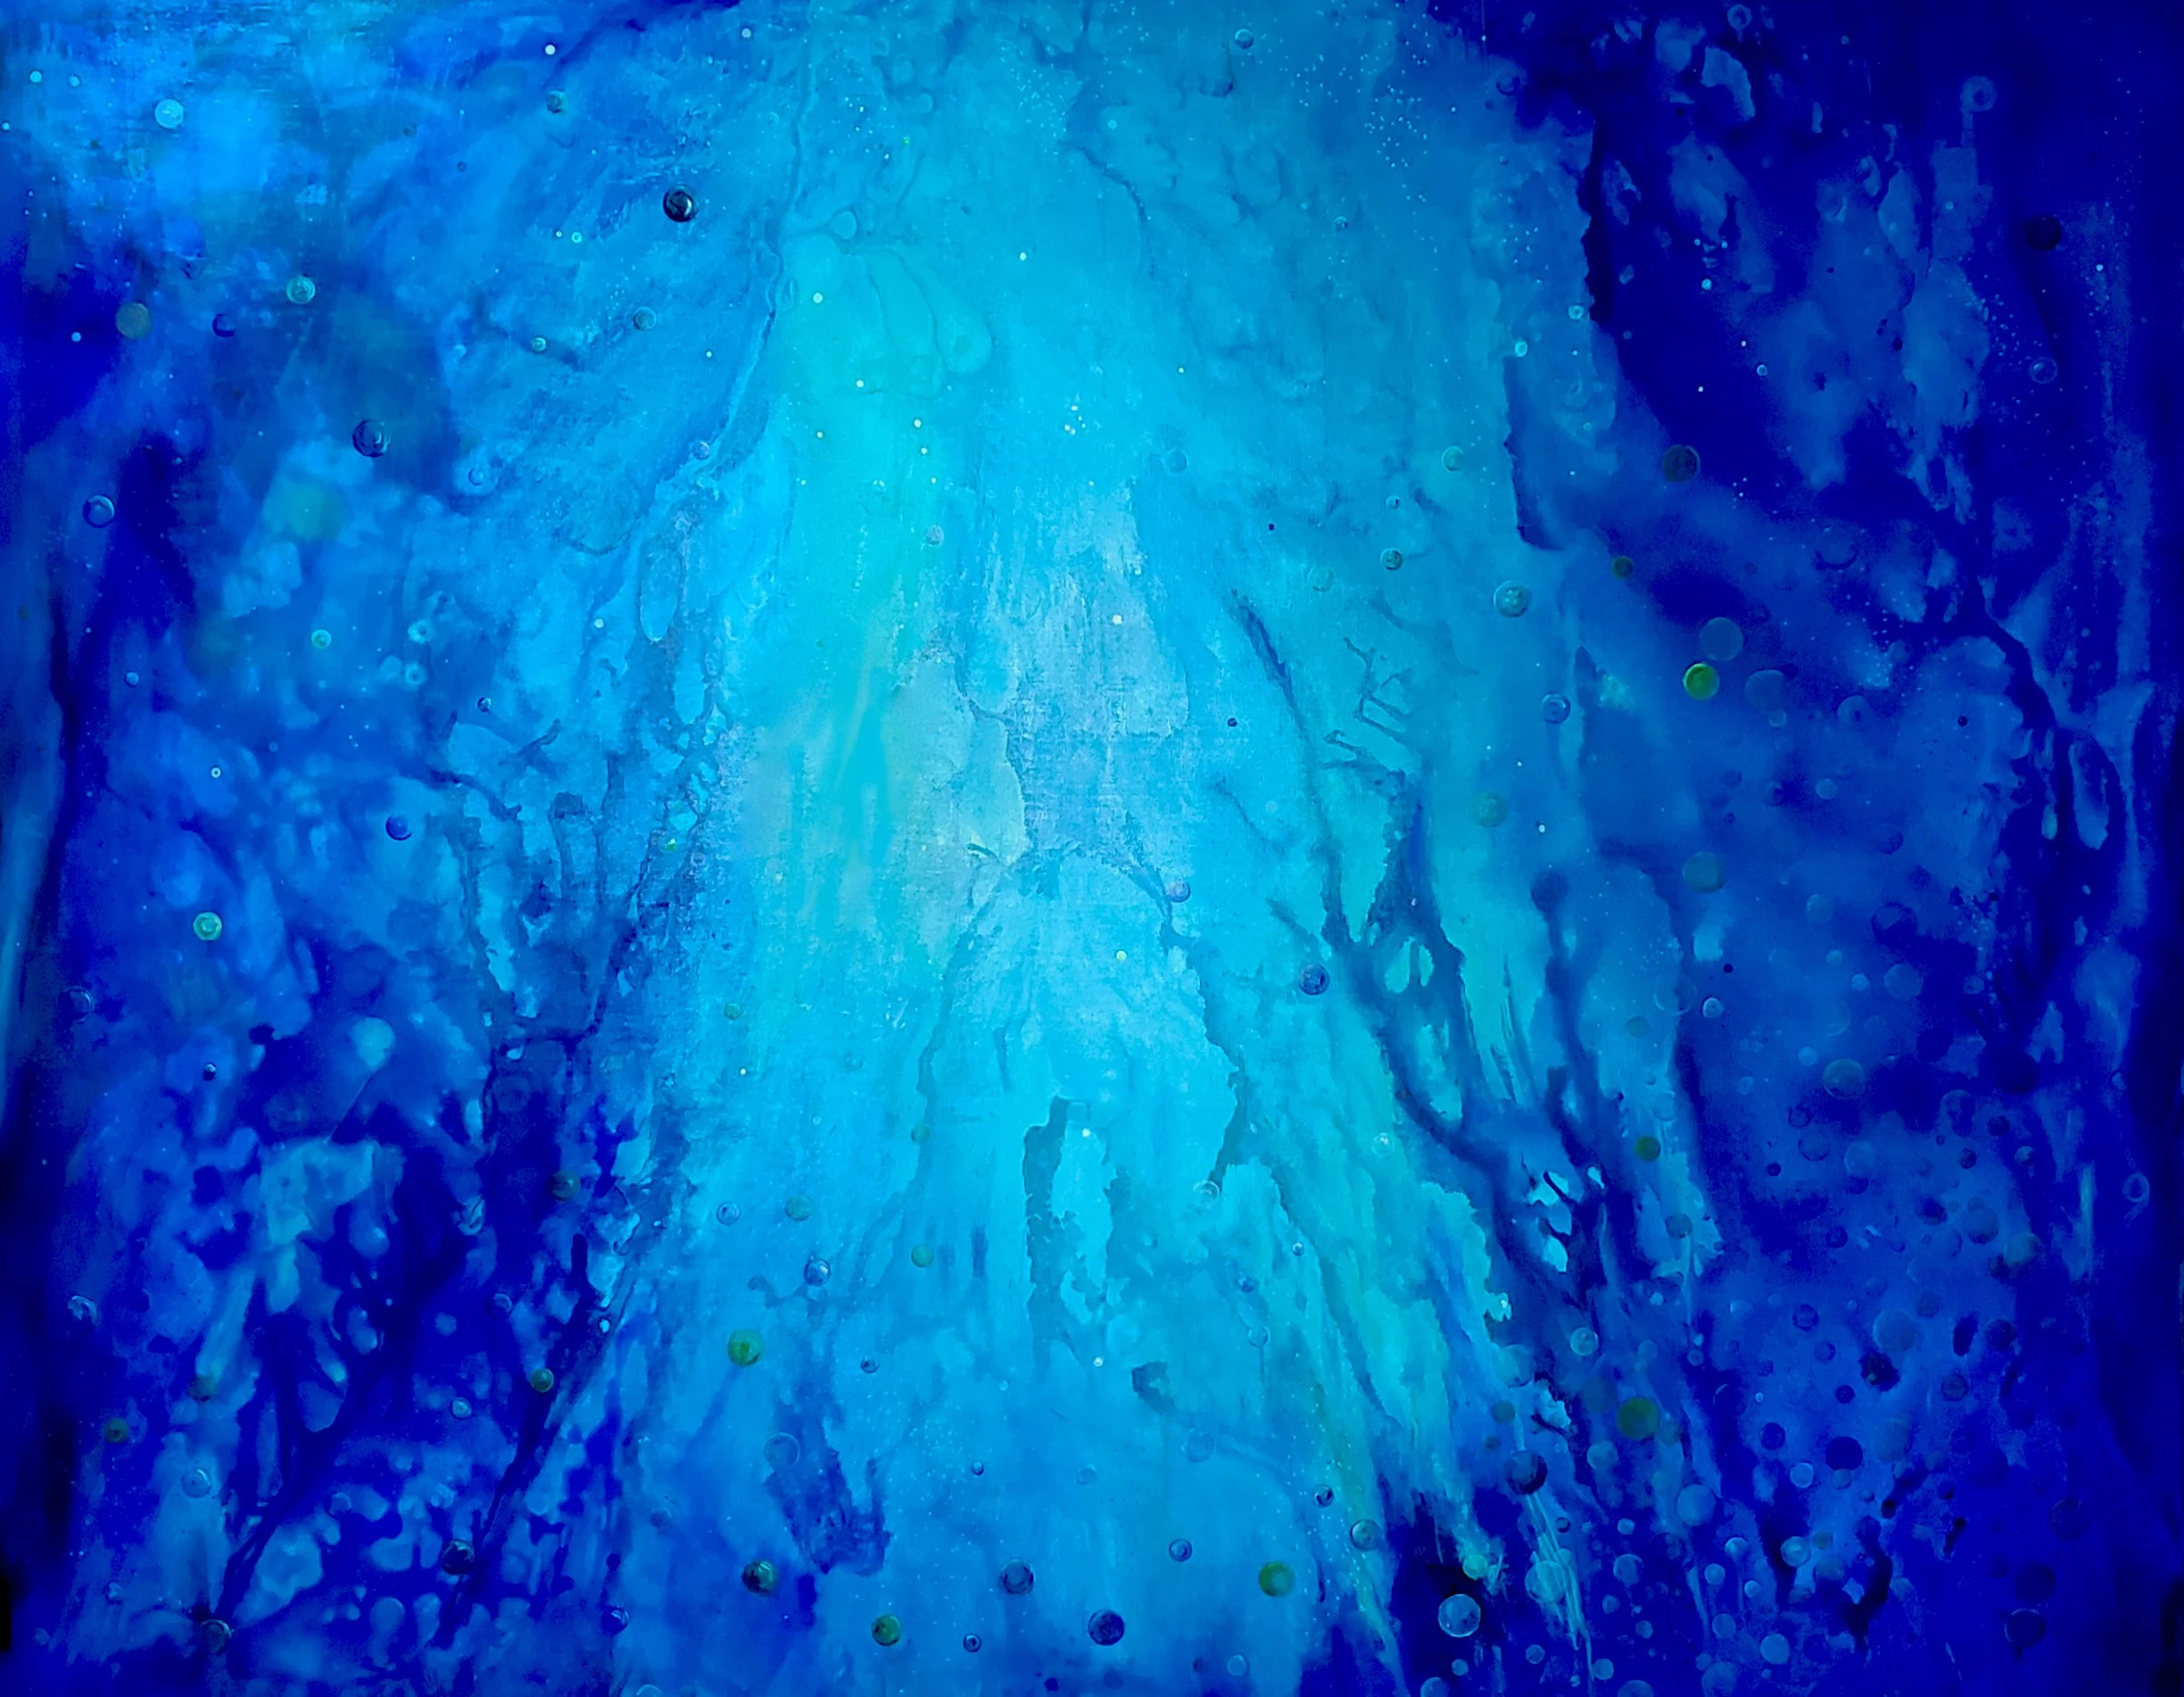
Deep Chlorophyll Maximum: Party Zone. 48x60. Oil over Acrylic on Canvas This work is the visualization of chemical data collected in the DCM where molecules like tryptophan travel down during the day and up to the surface at night, creating a constant cycling. The painting interprets the lively action in this zone as a party, and the molecules themselves as disco balls and balloons.

Asking Questions. 36x36 Acrylic on Canvas
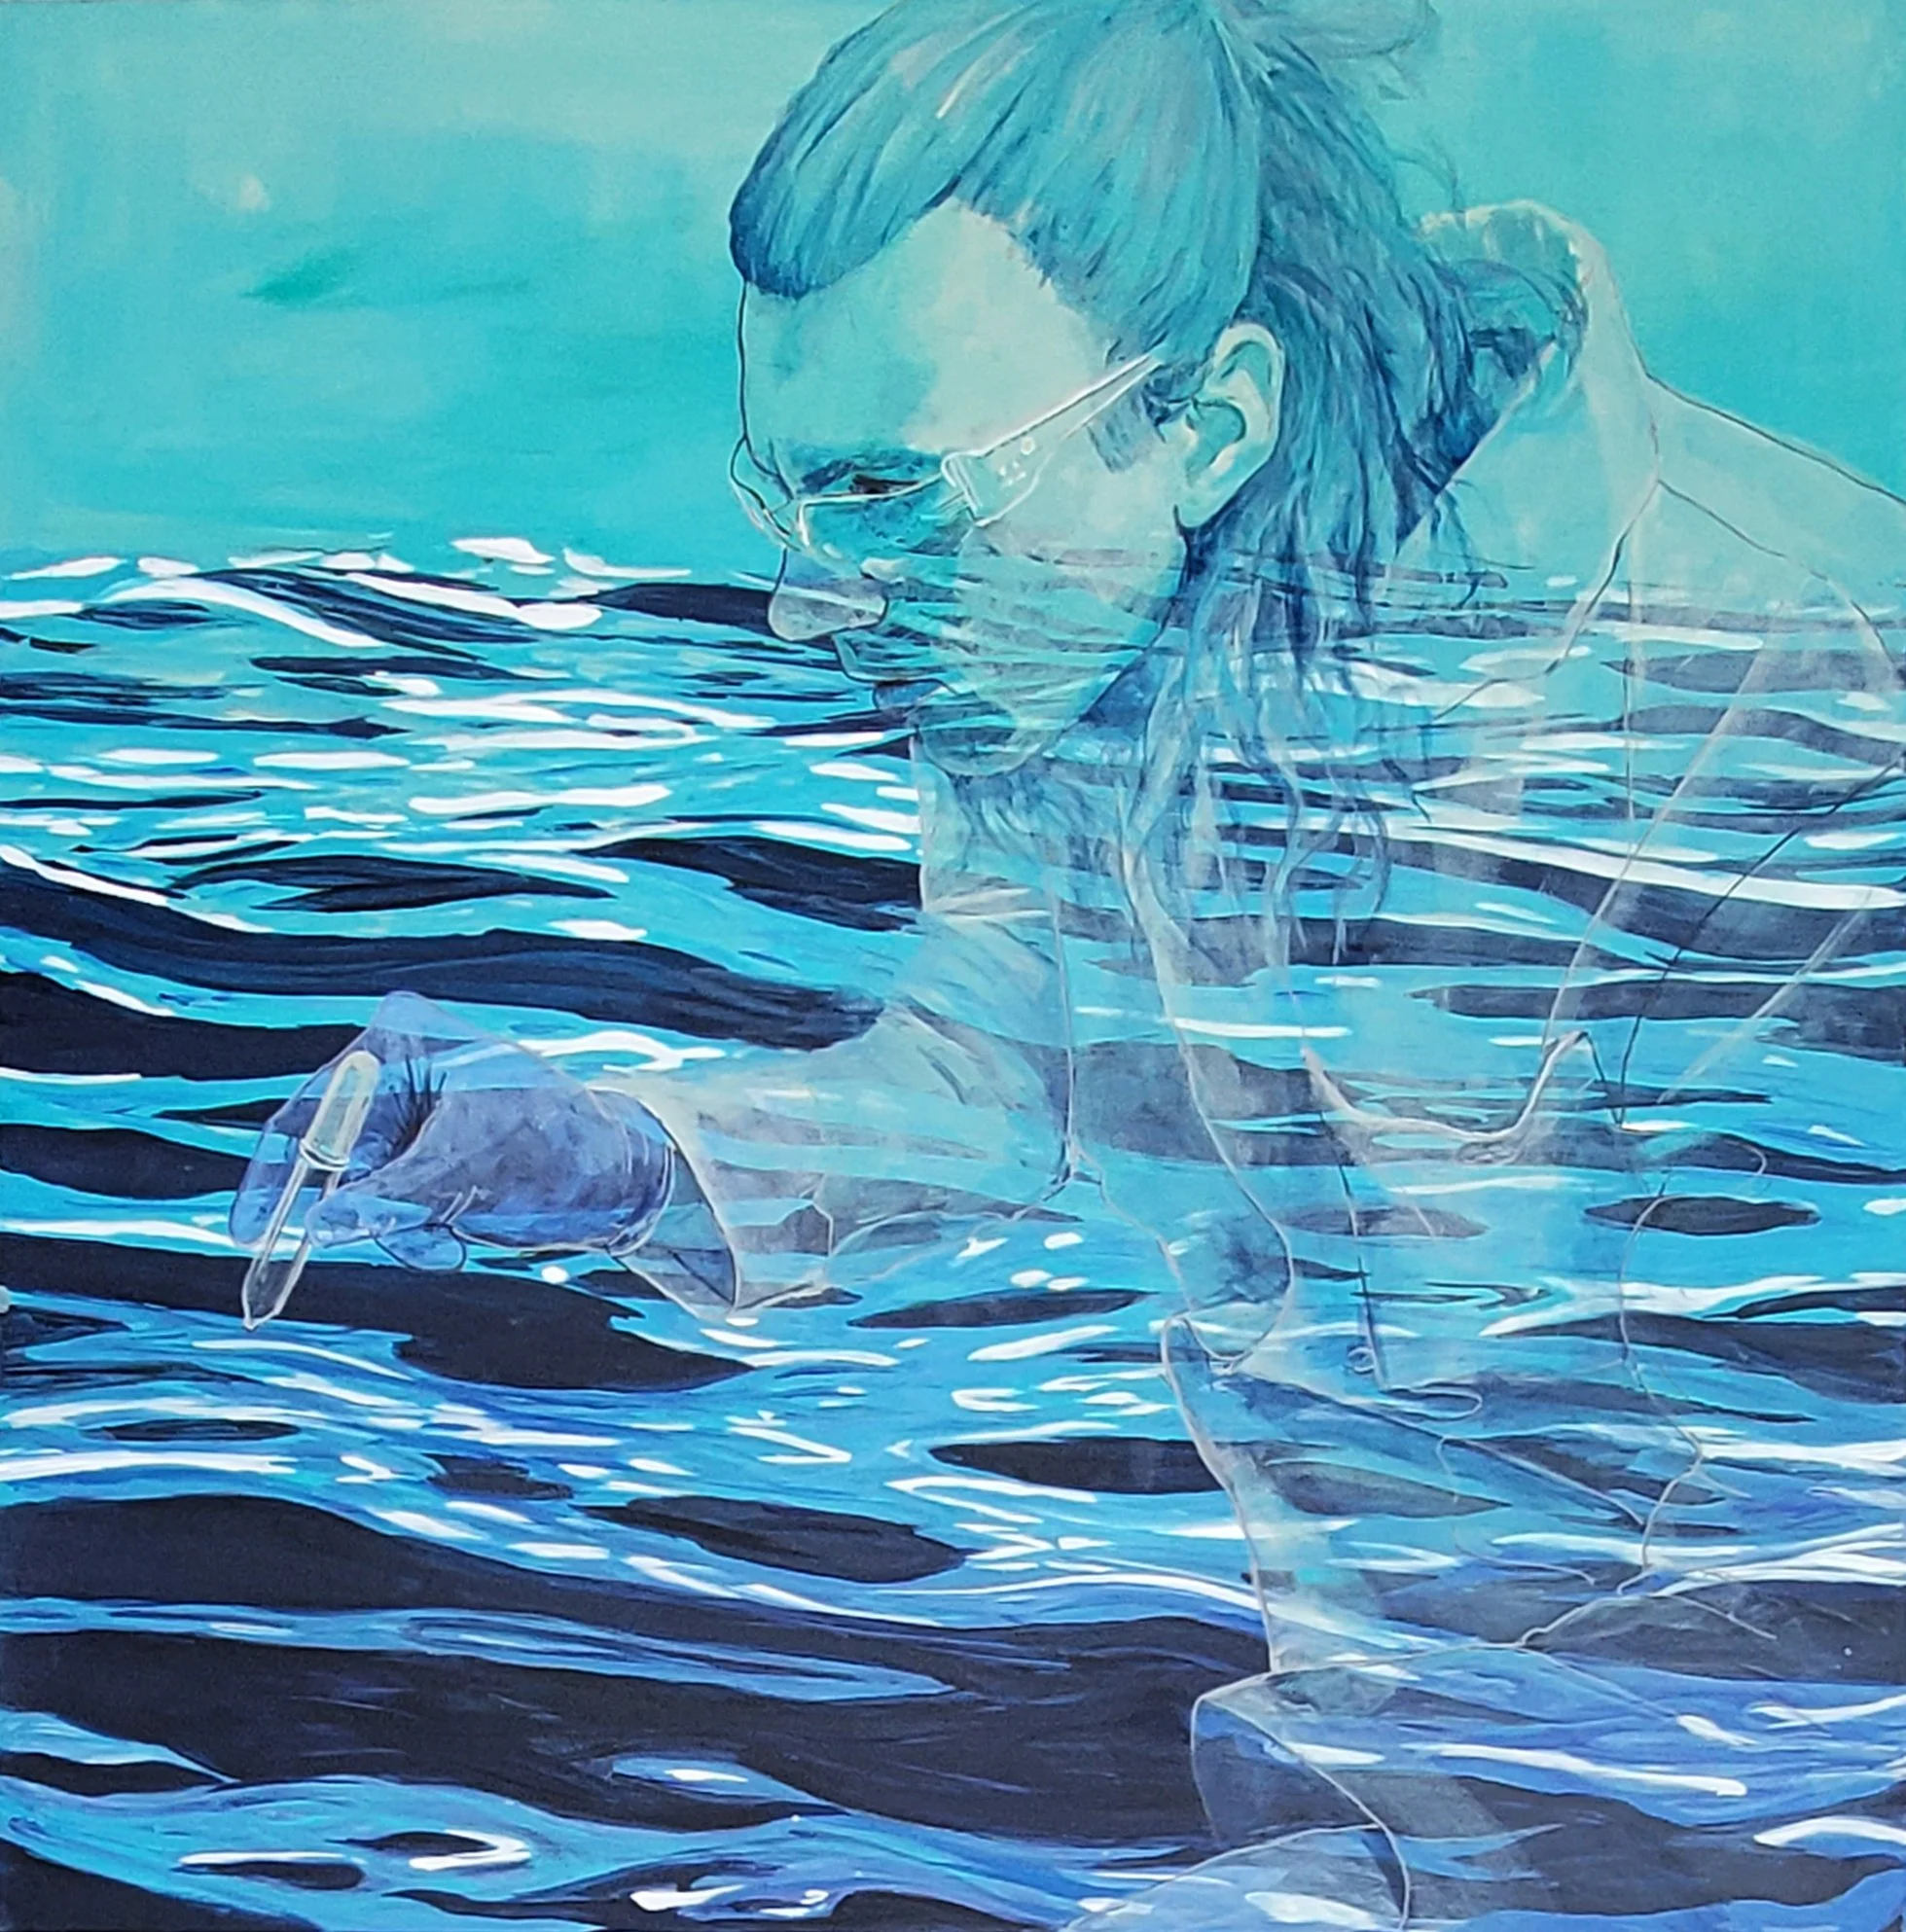
Seeking Answers. 36X36. Acrylic on Canvas

Breath of the Ocean. 18x24. Acrylic on Linen

Energy of the Sea. 18x24. Acrylic on Linen
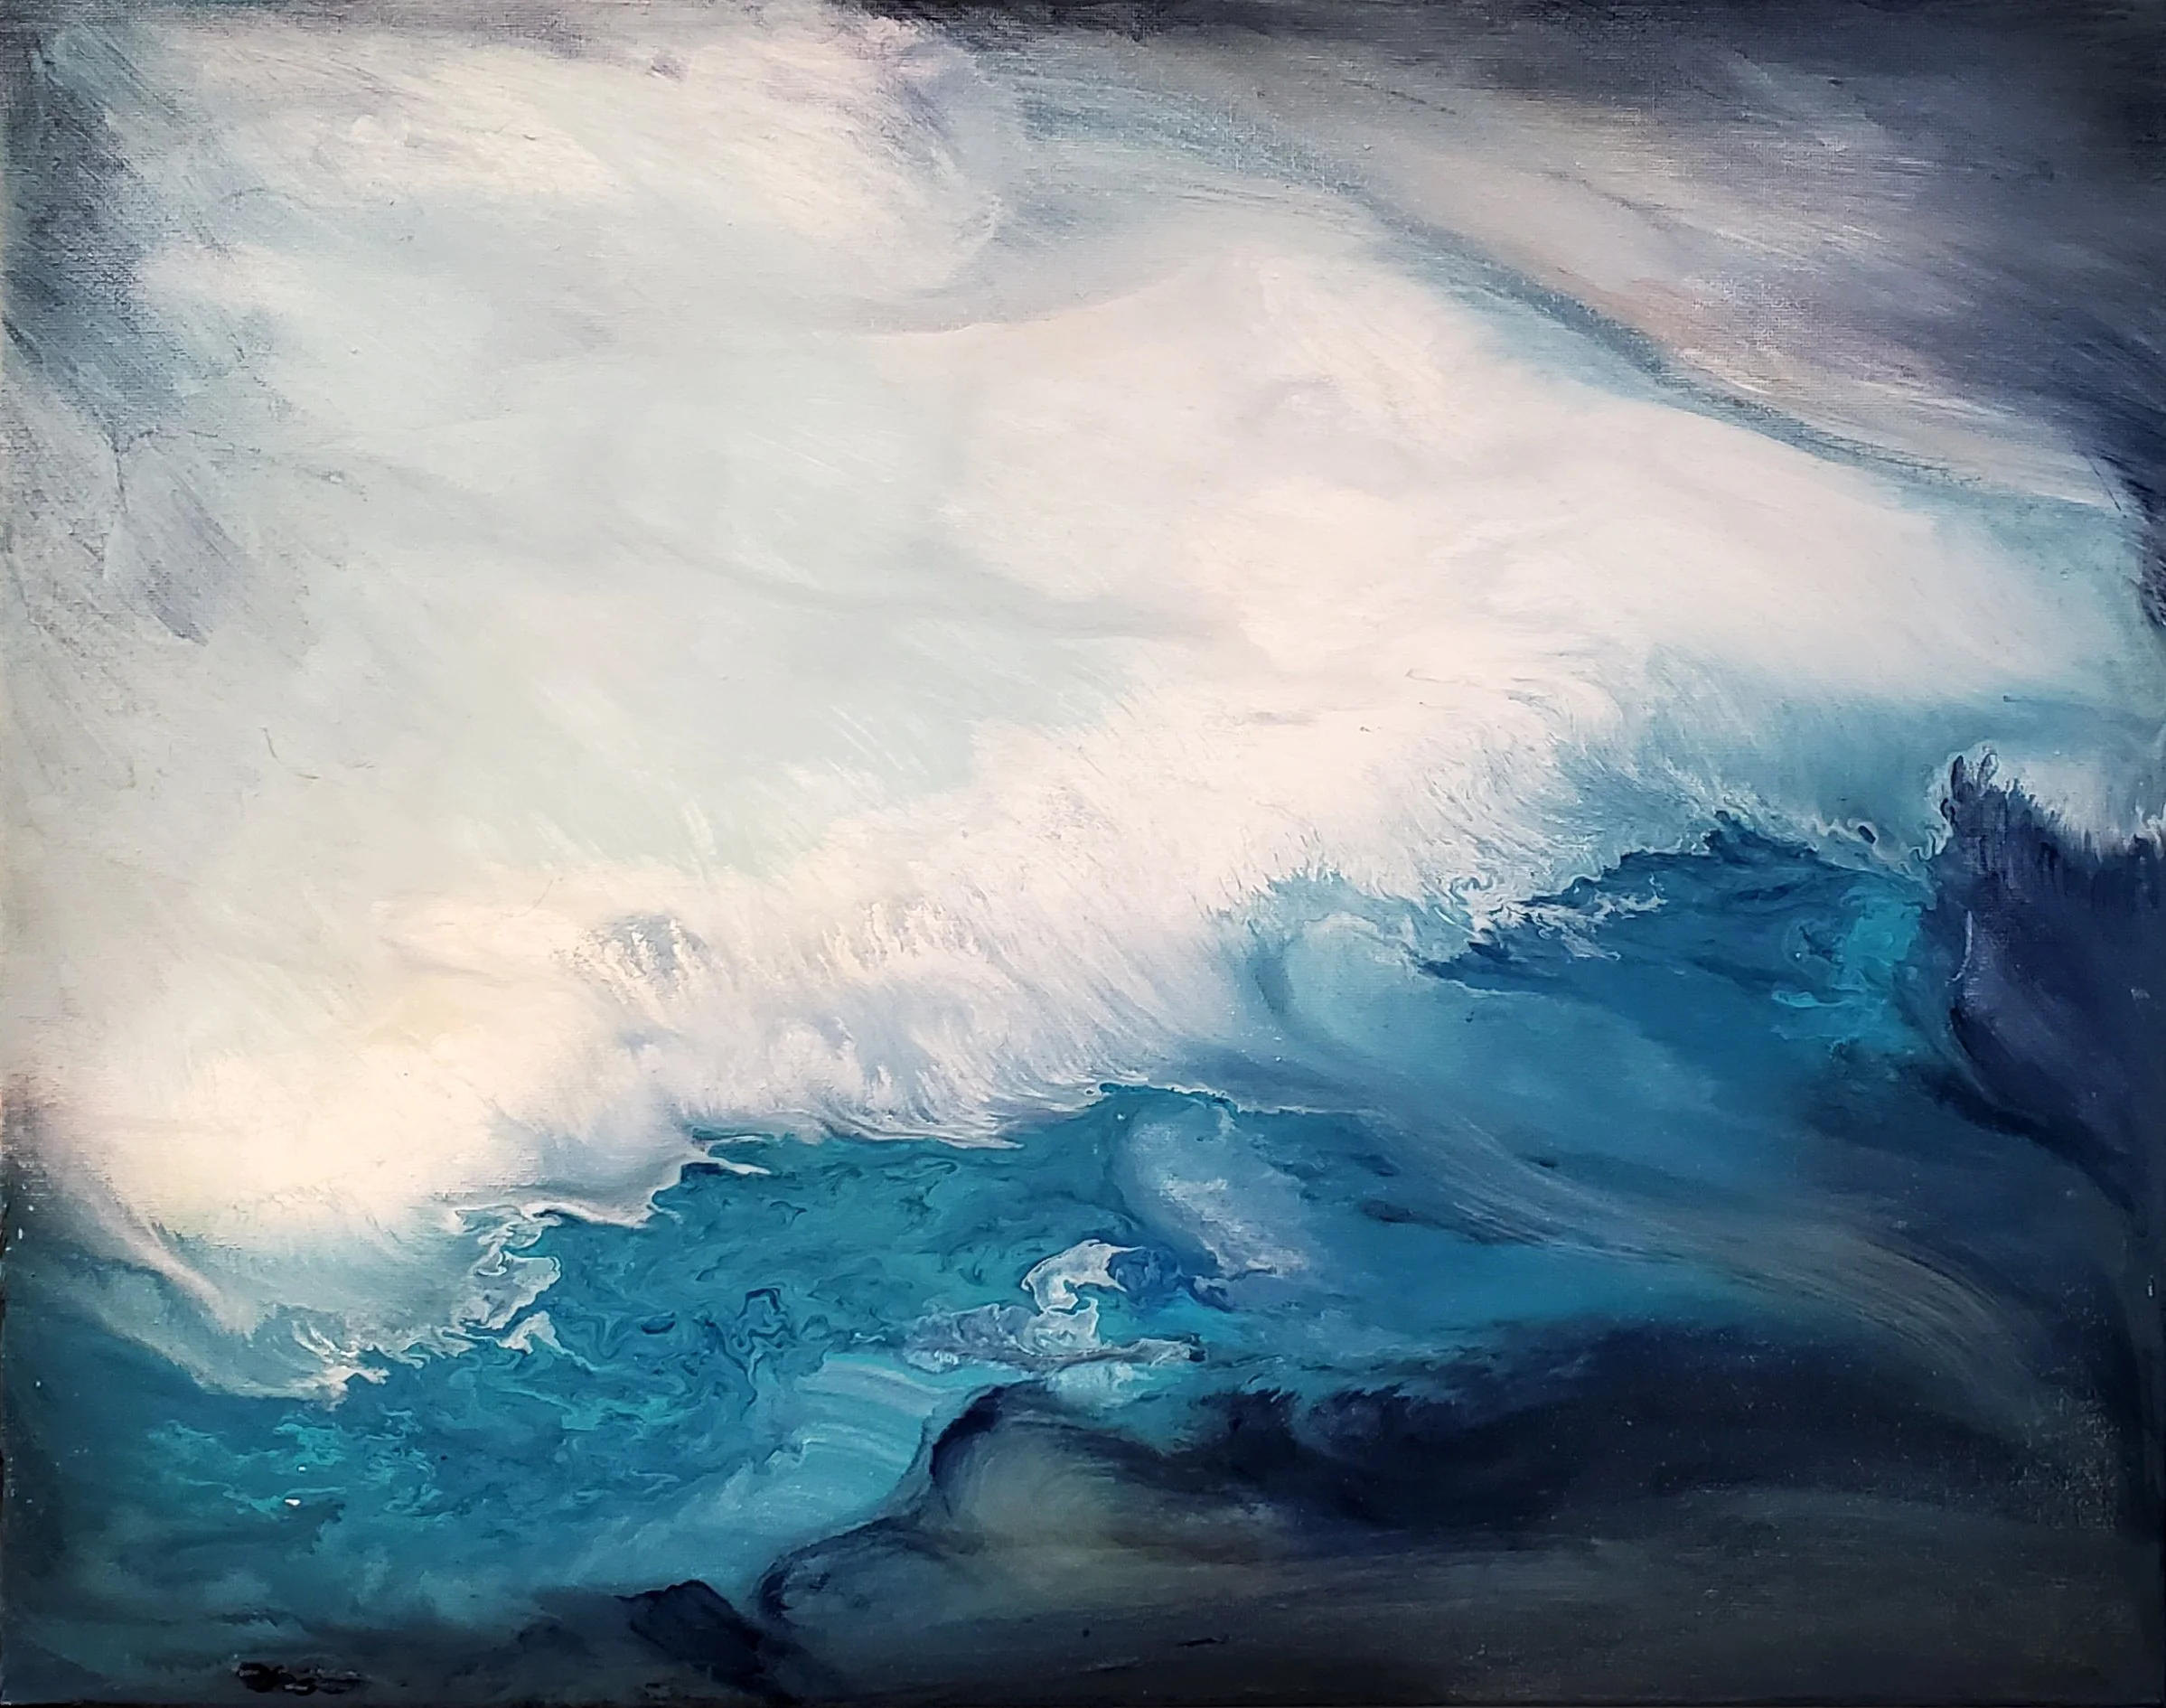
Polar Ice Caps. 18x24. Acrylic on Canvas

Water 5. 16x 20. Acrylic on Canvas